When it comes to advertising on search engines, timing can be everything in order to get ads in front of the right audience. The many facets of the demographics of your audience such as age, gender, and income can all have an effect on what times your ads perform the best. So how should you optimize when your ads show? With Google’s hour of day and day of week analysis, you can get valuable insights into when the best and worst times are to display ads on that platform.
How to Perform the Analysis
The report is fairly easy to locate in the Google Ads interface. While you are in your account, click on the “Reports” icon on the grey banner at the top of the screen. Then hover over “Predefined reports”, then “Time”, and you will see the two options for “Hour of day” and “Day of week”.
Pull up both of these reports, and you can adjust your columns to see the metrics you need. They should look like this at first:
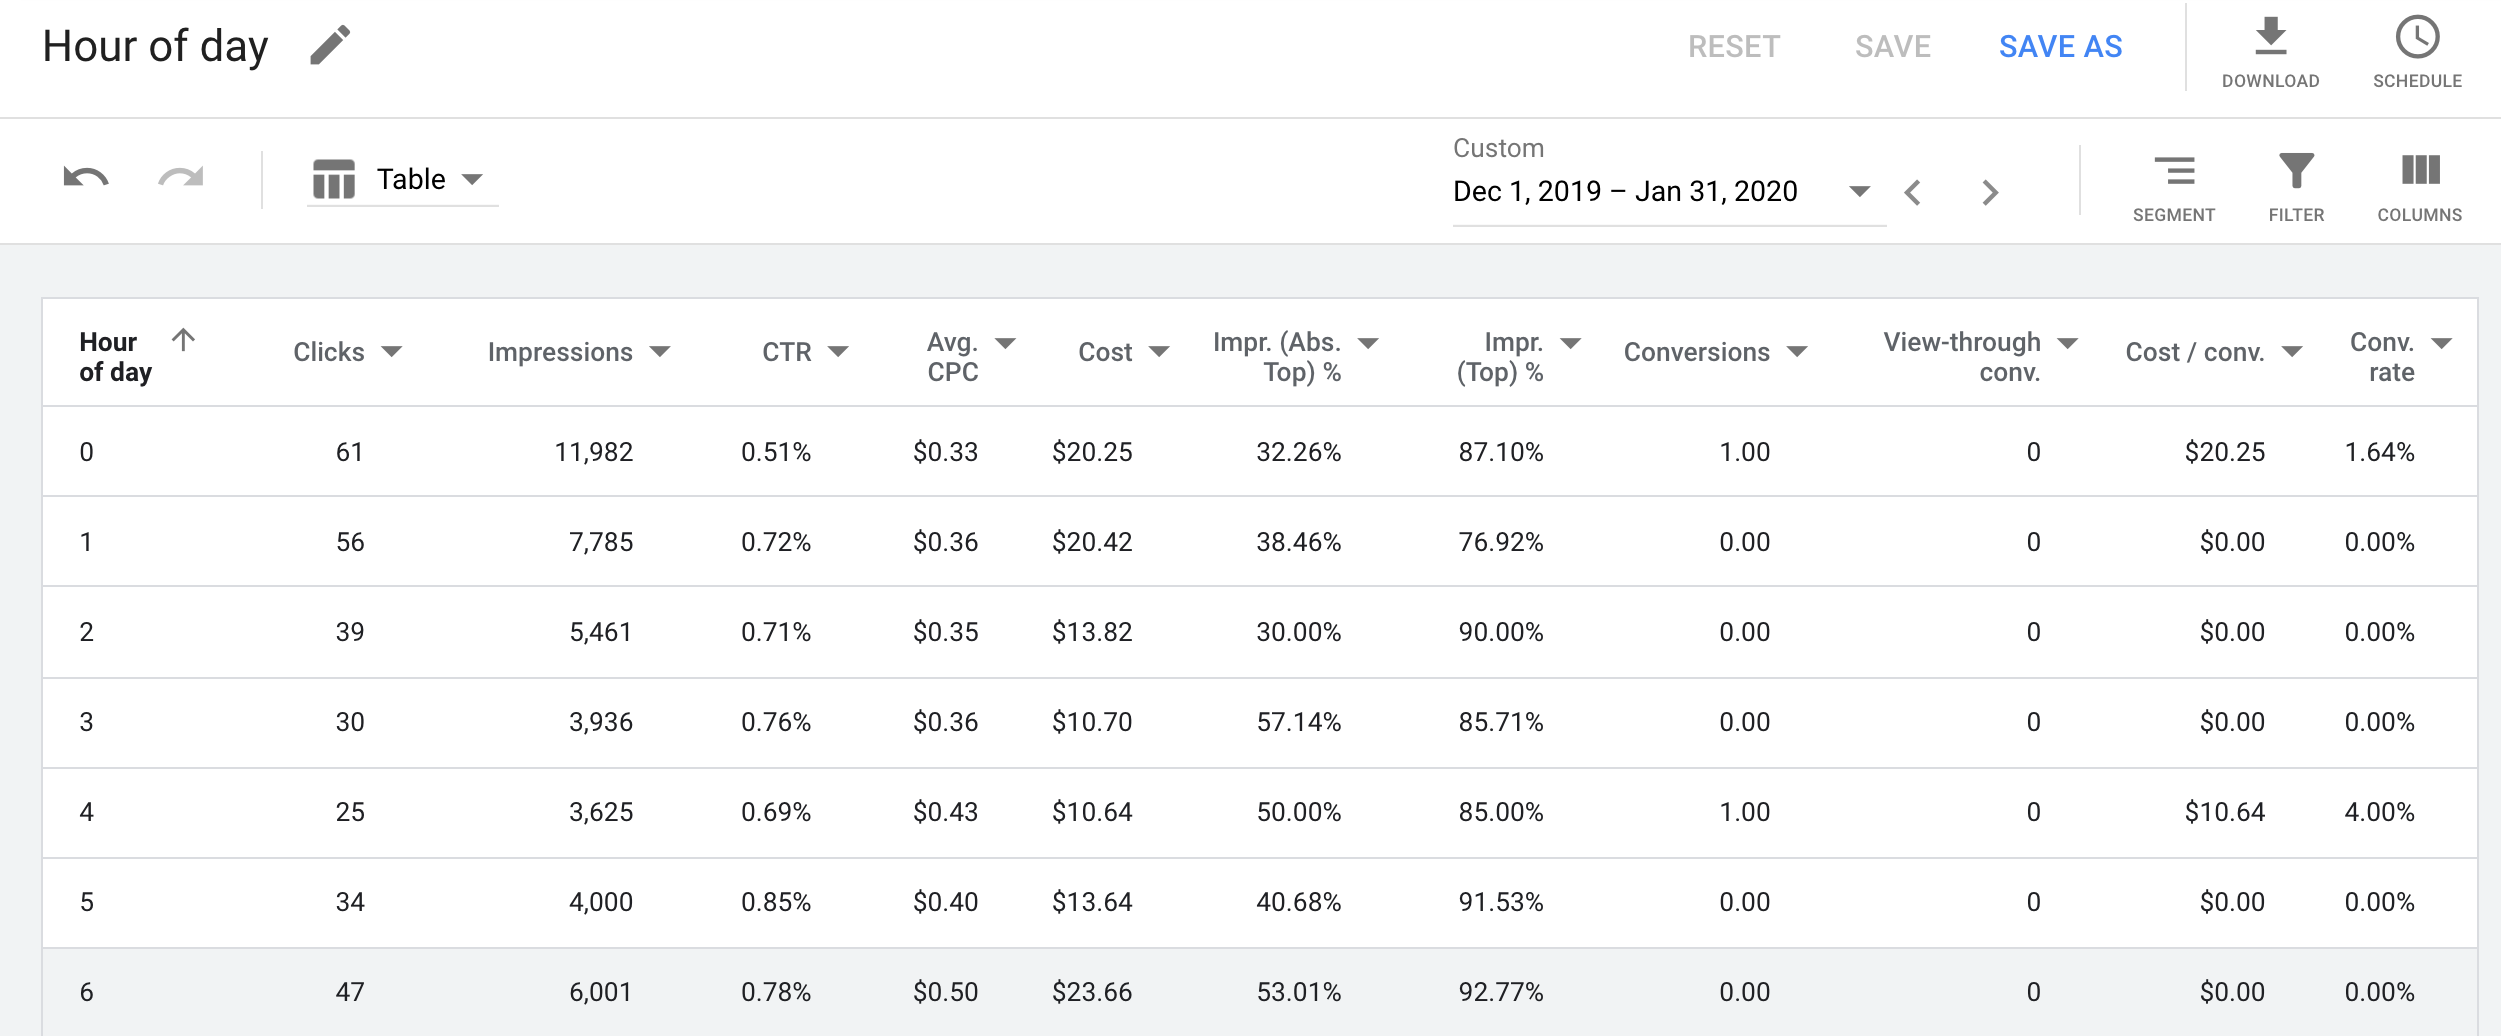
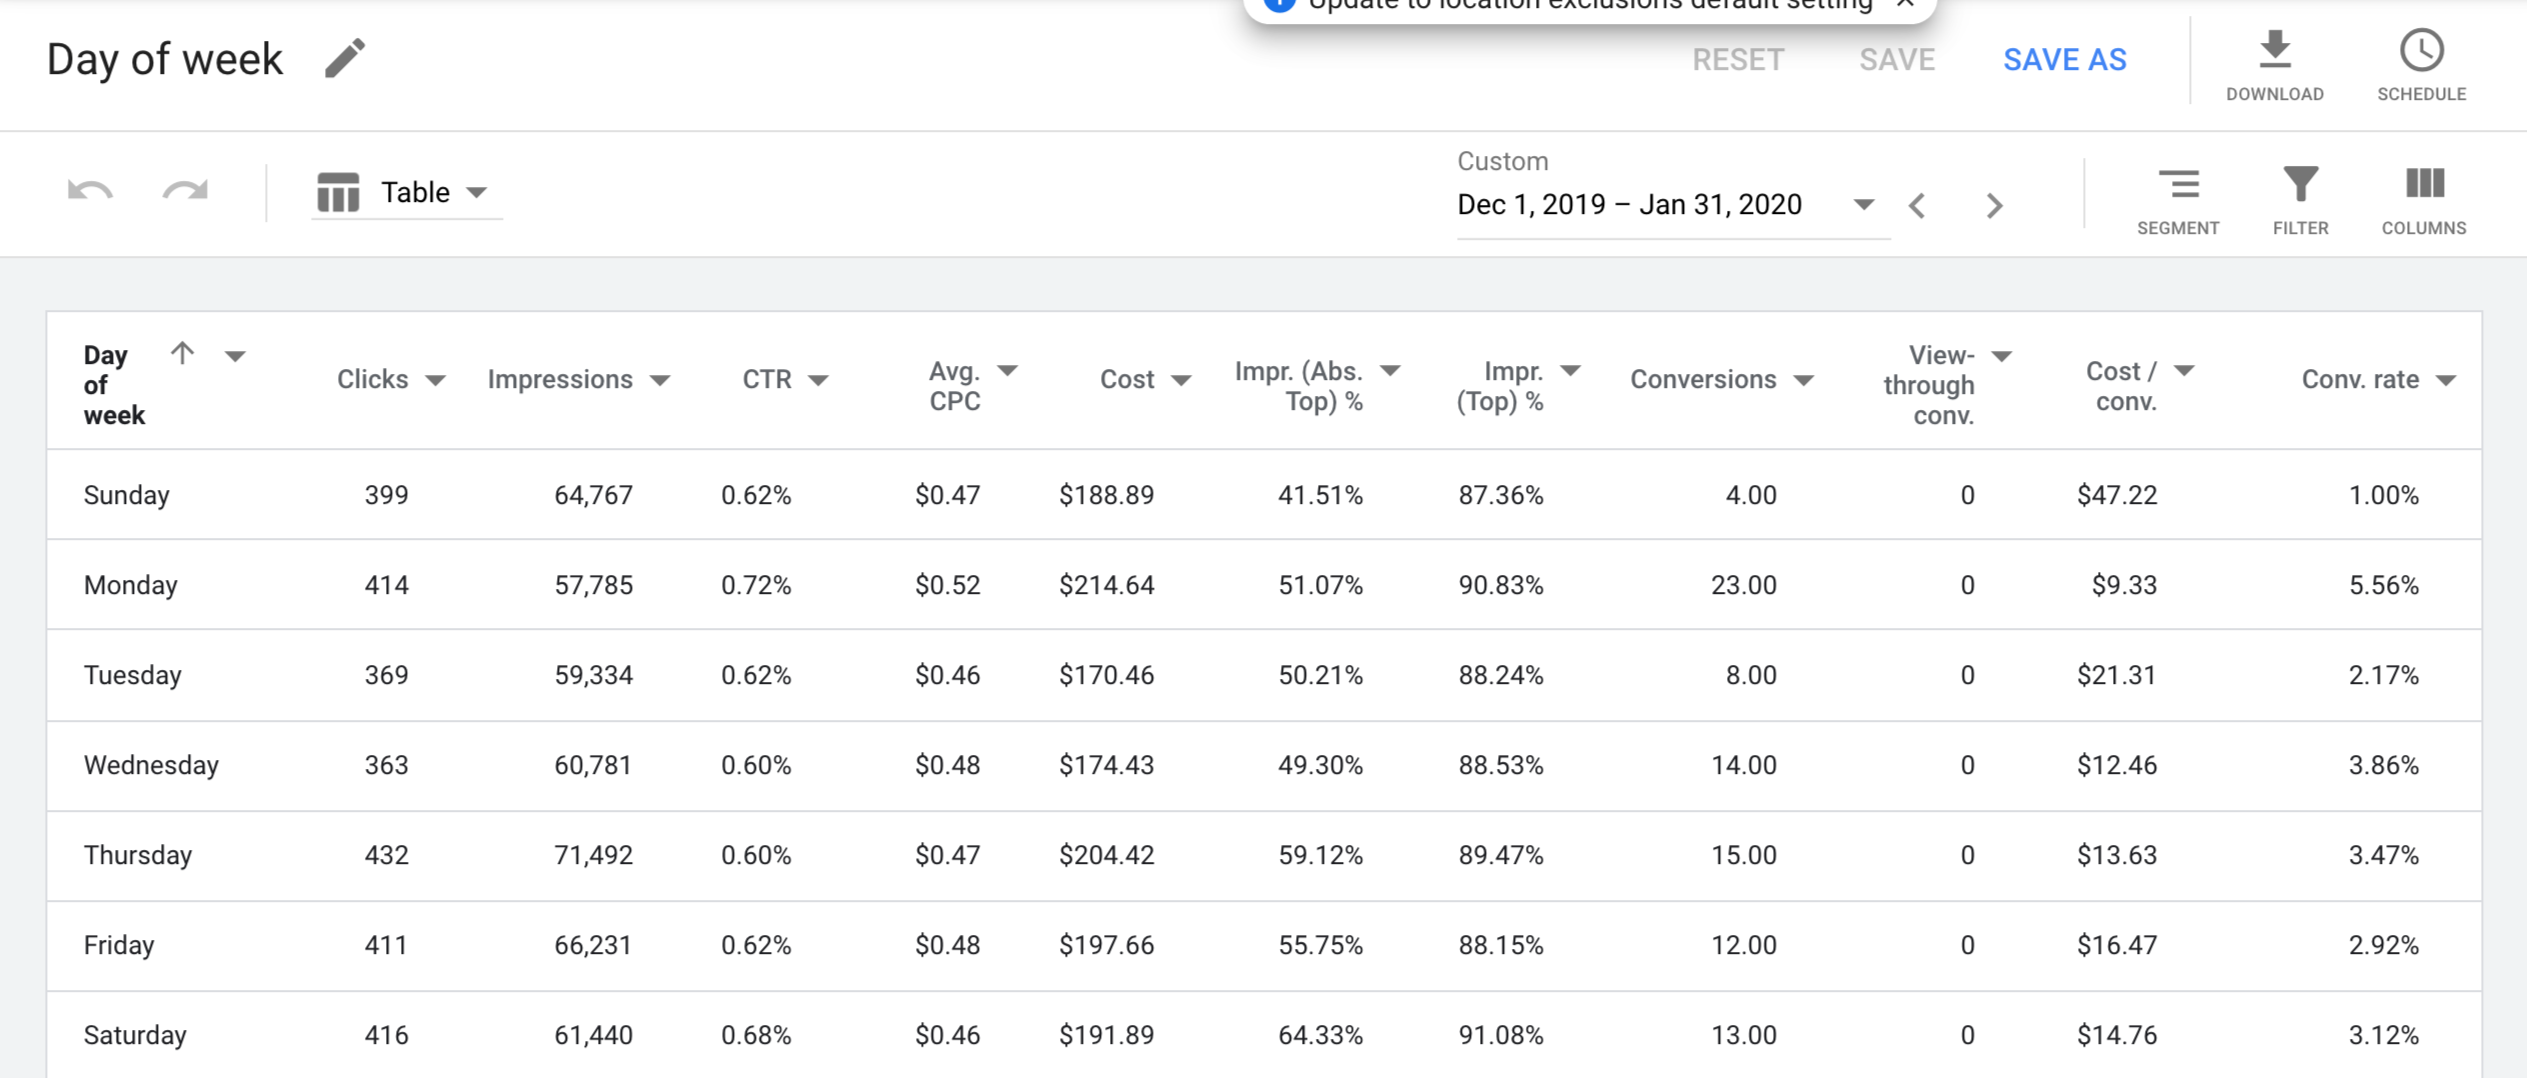
With these reports, there are a few questions you should ask in order to obtain the right data for analysis:
- What timeframe is appropriate for this account? Make sure you go back far enough in order to have enough to work with.
- What vertical is this account part of? Industries such as housing or law can have higher click-through-rates and a smaller amount of conversions. Keeping this in mind can help you make the most out of the data.
- Are there any specific oddities in this account? For instance, if the account is in a different time zone, it could affect the Hour of day report. Age can also be a factor, such as retired vs. college-age adults.
Based on this info, you then have the option to bid up or down on ads, and to show or not show them.
The Pros
After doing this analysis, there are obvious benefits that start to emerge. Using this tool, you can quickly ascertain aspects such as if ads are getting more impressions in the evening, if weekends have great conversion rates, and more. Conversely, if there are times where ads have lots of clicks but no conversions, it would be wise to bid down or not show ads during this time in order to save money.
Another great aspect of these reports is that you can look at many different aspects of data in one place. Whether it be search impression share, network, or even conversion value, you can view them in the Day of week or Hour of day reports.
The Cons
Even though these reports can be extremely helpful, it can be time-consuming to implement changes to the ad schedule in Google’s interface. Depending on the changes that you want to make, you may have to break out every day to adjust times properly. An example can be seen below:
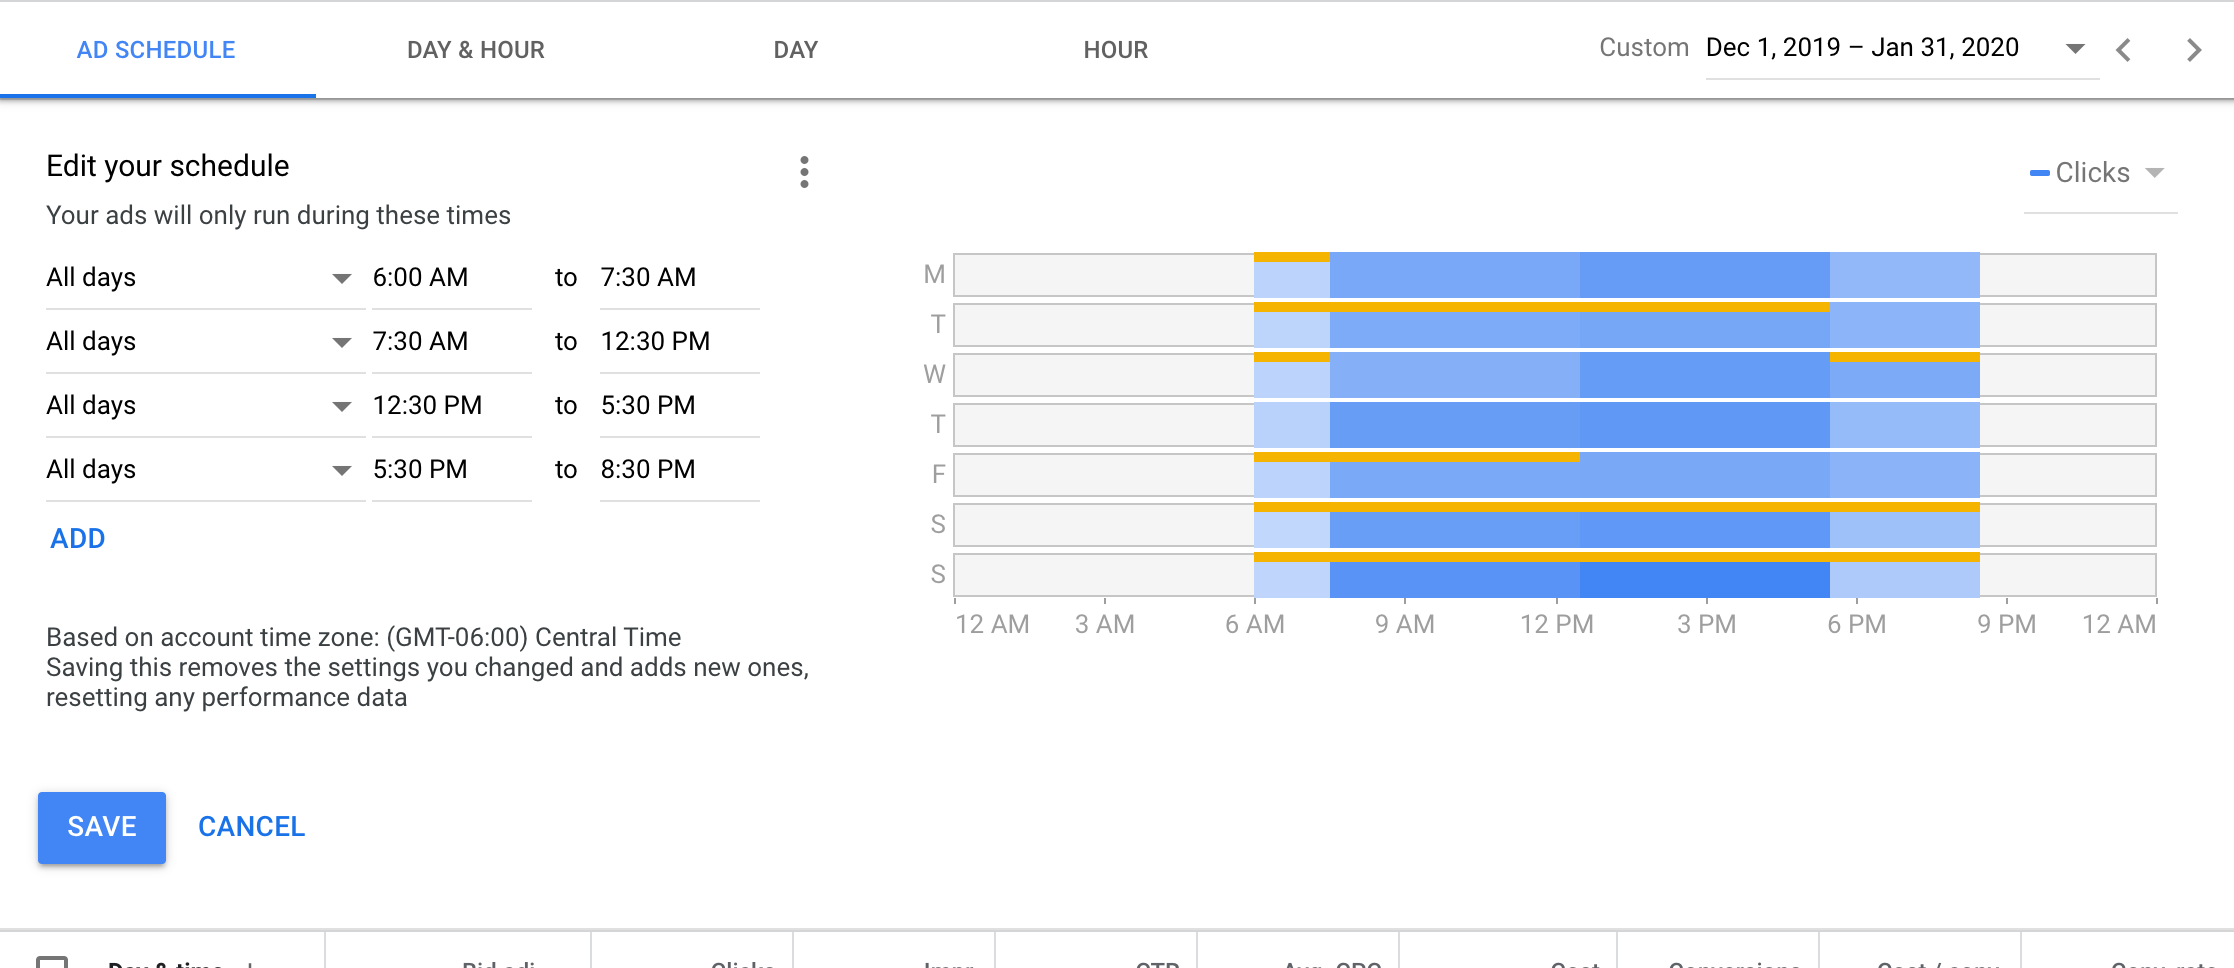
Unfortunately, if you want to specifically add a 20% bid to Tuesday from 9 am – 12 pm, you will need to block off that specific day and time. Despite this, it is completely worth it to work out days and times to a point that is manageable. It saves money, and it will help your account thrive because you know on what times you should bid higher or lower.
Is This Analysis Right for Me?
Even though it may seem complicated, we think it is a great idea for all accounts to take advantage of these reports. At WTM Digital, we do this as part of our PPC services, as we analyze this data and make changes at least quarterly. This helps us and will help you stay on top of any changes or trends that may appear during that period, and time ads properly so that you can optimize your paid search account.
Need help keeping up with your website’s traffic? Take a look at our SEO and PPC services.