Google Shopping is complicated, and we often receive questions from clients wondering how profitably their ad spend is being allocated across all products in a shopping campaign. This reporting task can seem daunting, but some setup and hefty use of the VLOOKUP function can make the job pretty simple.
Why We Need SKU Level Reporting
First, we have to address that this system is not perfect. There is no 100% best way to track revenue, much less product specific revenue. It is up to each business to choose 1 or more attribution models to track as a measure of success. Visitors that convert off just one source/medium do not represent the majority of shoppers, so a good attribution model helps advertisers decide how much of any conversion could be attributed to organic, paid, social or other sources. This guide will help you understand which products are profitable and help pinpoint products you need to exclude from your shopping campaigns.
A Single Product Example
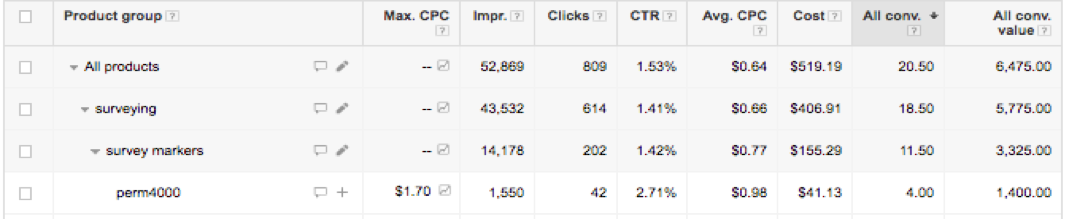
To begin, it’s important to understand that Google AdWords attributes all sales revenue to a particular ad, not to individual SKUs. So the data that is shown at the SKU level within AdWords is all data from an ad for a SKU, not actual sales data from the SKU itself. In our example below, SKU perm4000 had 4 transactions and $1,400 in sales in the last month. This doesn’t necessarily mean that we sold 4 perm4000s and made $1,400 in perm4000 sales. Most likely, of these 4 people that converted off the perm4000 ad, some bought multiple items or bought an entirely different item. AdWords views everything in terms of ads, not SKUs, so all of the data is in terms of ads for that SKU. The important distinction here is that the line for perm4000 does not contain data specific to that particular SKU, but is actually data from the ad that appeared with SKU perm4000 as the image and landing page.
This leads us to our next problem. We can’t report purely on AdWords figures, because we now understand that sales revenue from the shopping ads is a blend of the products that actually appeared in the ads, as well as other products that were part of a sale related to a shopping ad. Right now, all we know is we spent $41 on ads for perm4000 and generated $1,400 in sales. But how much money did our shopping ad make off sales of the item perm4000? To find out, we’ll turn to Google Analytics.
In Anayltics, we pick the same date range as our AdWords sample, then navigate to the Conversions > Ecommerce > Product Performance tab.
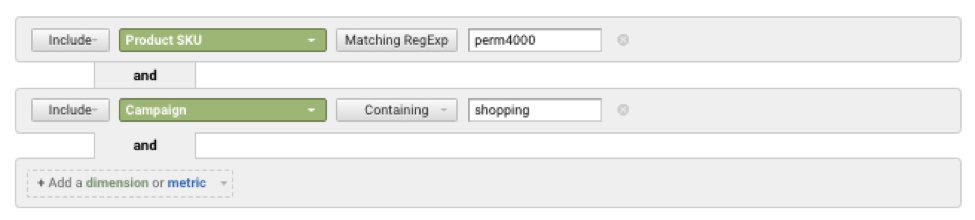
Then we change our primary dimension from Product to Product SKU and add a filter for perm4000. This gives us the sales figures for all perm4000 sales, but we want only those related to our shopping campaign, so we need to add another filter. In this account, all of our shopping campaigns contain the phrase “shopping” in the campaign name, so we can add a second filter to show just perm4000 sales from shopping campaigns. You will need to find your own way to isolate your shopping campaigns, but below is a sample of how our filter looks.
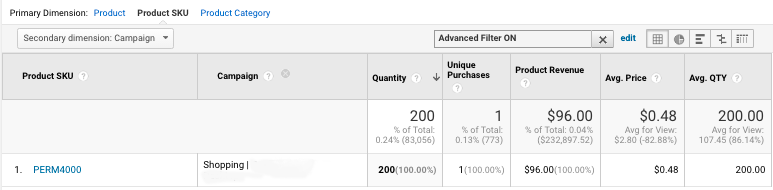
Looking at our results, shopping ads for perm4000 only resulted in 96$ in sales, and our AdWords spend for the item was $41. Unless we have incredible margins on perm4000, Google Analytics seems to suggest we need to cut ads for this SKU, as it just isn’t profitable. However, we know from AdWords data that advertising perm4000 resulted in $1,400 in revenue, so it is actually profitable. This example proves that we need multiple views of our SKU level data to get a good picture of how our shopping ads are working.
In this particular case, perm4000 is actually is a specific auto part with an average sales volume. What is much more common is sales for a repair kit that contains perm4000, as well as the other items recommended as part of a particular repair. Understanding this brings the full story into light. Although individual sales of perm4000 from Analytics don’t justify the spend, its obvious that advertising this item is leading to user clicks that then purchase complimentary items instead, like the full rebuild kit.
How To Create Your SKU Level Report
Now that we have established the need for different viewpoints to determine SKU level profitability, lets move into how to represent this data. We need to pull data from both Google Analytics and AdWords, then condense that info into one sheet for analysis purposes.
Reporting Template
- To get started, make a copy of this Google Sheet template for your own use.
- Once you have your own version of the file, you will need to populate the first two columns with your own product data, preferably from Google Merchant Center, or wherever you store your product feed. Simply copy and paste your data in. We really only need the SKU column, but depending on your product naming convention you might find it convenient to have that column as well.
Google Analytics Pull Instructions
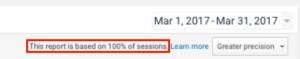
- Login to your Analytics account and select your desired date range. Be sure you are pulling a full data sample, not a partial. Depending on your site size and SKU count, your date range might force Google to pull a sample instead of a full report. Just below your date range in the upper right you should see a note about your sampling size.
- On the left side bar, navigate to Conversions > Ecommerce > Product Performance tab.
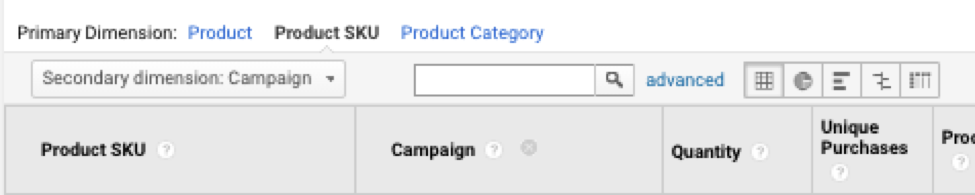
- Set your primary dimension as Product SKU.
- Add a secondary dimension of Campaign.
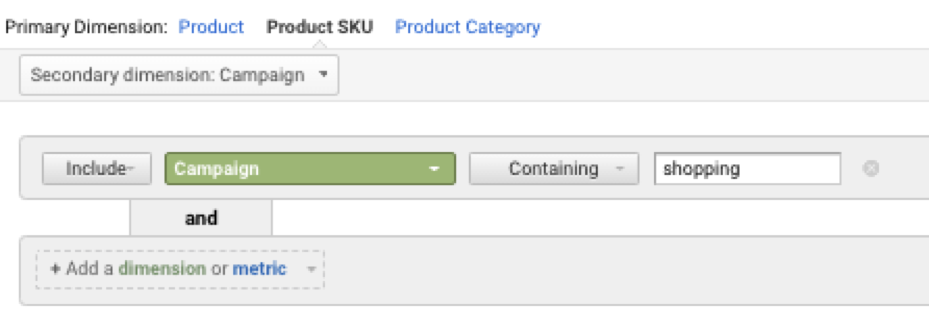
- Click the “advanced” button above your data to add a filter
- Create your own filter that includes all shopping campaigns, but no search or display campaigns. In this case, all our Shopping campaigns have the word “shopping” in the title so we will filter by that, as seen below.
- Export this data into Excel. Make sure you downloaded all the rows, not just the 10 that show by default.
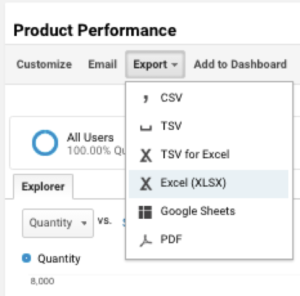
- Save the download as an Excel file on your desktop. A CSV or other format might not allow you to run pivot tables, so double check your file type.
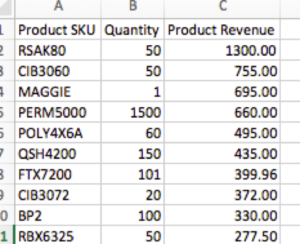
- Open your file and delete columns until you are left with just Product SKU, Product Revenue, and Quantity. Your data should look like the sample below.
- We will now need to run a pivot table to remove duplicates. This step is necessary if you have more than one shopping campaign.
- To run a pivot table, highlight your data then click Insert > Pivot Table.
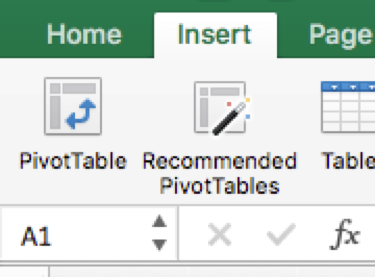
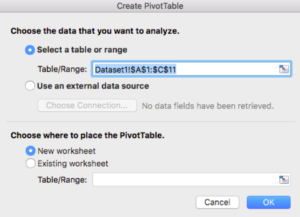
- Make sure the Table/Range includes all your data, then click OK.
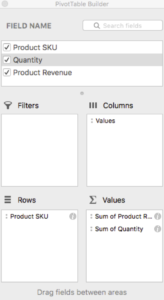
- This will open the Pivot Table Builder. To format the data we need, drag and drop Product SKU into the Rows section, and Product Revenue and Quantity into the Values section.
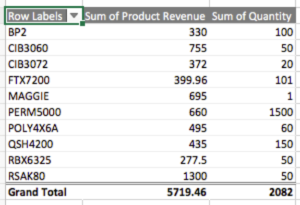
- Now we have de-duplicated data! Make sure your columns are in the same order as the sample below. If not, open up your pivot table builder again and re-arrange the fields.
- Finally, we need to copy and paste this data into the Raw Analytics SKU Data tab in your new Google sheet, making sure your data is aligned with our header rows.
AdWords Pull Instructions
- Login to your Google Ads account and select the same date range as your AdWords data pull.
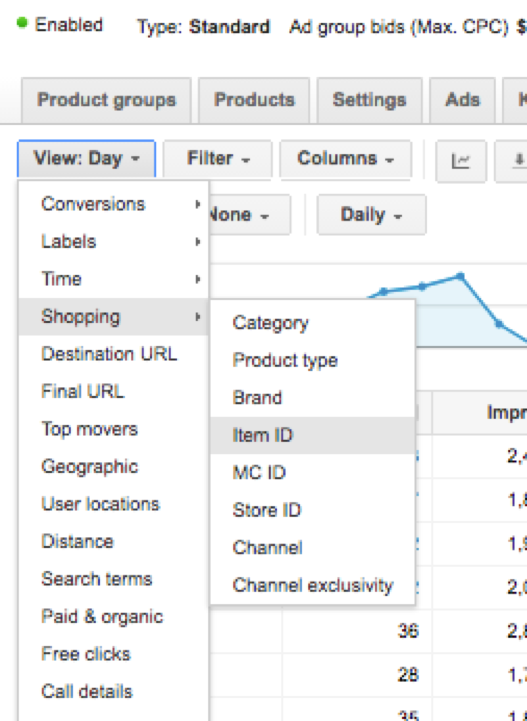
- Navigate to the Dimensions tab, then change the View dropdown menu to Shopping > Item ID, as shown below. Make sure you have selected all shopping campaigns, not just one campaign.
- Make sure the Cost and Total Conversion Value columns are included.
- Download the file. We will not need to run a pivot table for this data, as it should not have any duplicates.
- Delete columns until you only have SKU, Cost, and Total Conversion Value remaining.
- Copy and paste your data into the Raw AdWords Data tab in the Google Sheet
Now that all our data is uploaded, we can view our SKU Report tab to evaluate our results. The VLOOKUPS already in the Google sheet should have performed a search against the SKU number column to populate columns C through H. Now we can see all your SKUs with a side by side Analytics vs AdWords revenue comparison. If you have lots of cells with 0’s, try expanding your date range for both data segments so that there is more SKU overlap to fill in those blanks.
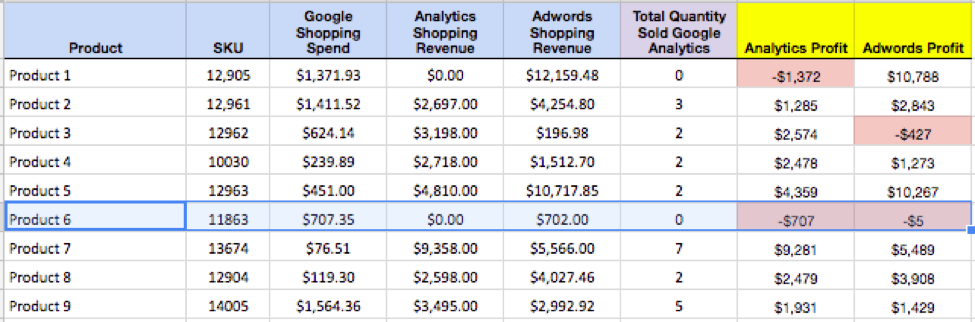
The conditional formatting built into the sheet should highlight anything with a profit below $0. What we can look for now is products with double negatives, like Product 6. We can see in our chart that ads for Product 6 haven’t resulted in profitable sales figures for itself, nor in sales for other products, so it would be a good idea to cut or limit the budget/bids for this item within AdWords.
Evaluate all your data or sort to find the products you need to cut. If you want even more data, a bit of tweaking and some extra columns could get you things like product costs or margins to get individual SKU ROI. Keep digging for insights, and use this report to inform your future decisions about segmenting your products in Google Shopping campaigns!