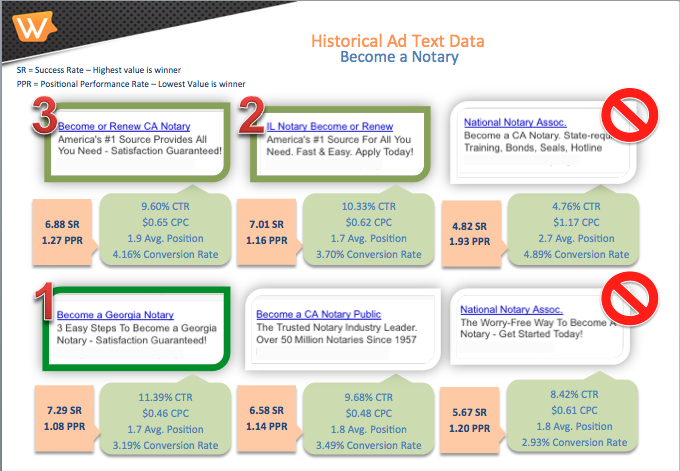
It’s not always easy picking a winning ad. As search marketers, we talk about split testing constantly, and in theory, we are spot on. You should be evaluating your ad performance continually, and replacing under performing ads with new text/images at a regular rate. But what metrics are the most important to determining which ad is the most powerful?
The answer to that question isn’t simple, especially since each business is a little bit different. Conversion points for one business may be of a higher value than another, or you may have multiple conversion points of varying values. You may put more value on traffic or click-thru rates than conversions, depending on your business model. I have developed a top-level set of equations to help determine ad performance across the board. How you use the data it produces it up to you, but it should give you an understanding of ad performance at its most basic level.
The ad performance algorithms are broken out into two parts. First, the Positional Performance Rate (PPR). To determine an ad’s PPR, use the following equation:
(Average CPC + Average Position)/2 = PPR
For example, if I have an ad that has an average CPC of $0.50 and an average position of 1.3, my PPR = 0.9. The idea behind the PPR is to have the lowest value possible. This means you are paying the absolute least to be in the highest positions. An ad with a PPR of 0.90 would beat out an ad with a PPR of 1.05 if you are only determining ad performance on bringing in valuable traffic. This works for branding campaigns across both the Search and Display Networks.
The second equation to evaluation ad performance is called the Success Rate (super awesome name, right?) or SR. To determine an ad’s SR, use the following equation:
(Click-Thru Rate + Conversion Rate)/2 = SR
For example, if I have an ad that has a CTR of 2.50% and a Conversion Rate of 10.00%, my SR = 6.25. The idea behind the SR is to have the highest value possible. This means you are getting the most traffic and the most conversions with this ad. An ad with a SR of 6.25 would beat out an ad with a SR of 6.15 if you are determining ad performance based on conversion metrics. Pretty much every campaign can appreciate conversions as long as it is bringing the business something of value, such as a sale or a lead or heck, even a newsletter subscription!
How do I use these equations if I value traffic AND conversions?
Well, my friend, you need to look at both the PPR and SR to determine a winning ad. This means you have to use a little bit of your data-hoarding abilities and a little bit of what I like to call “best judgement”. Here is a prime example:
Ad Variation 1: PPR 1.05 and SR 15.41
Ad Variation 2: PPR 0.88 and SR 15.17
These ads are pretty close in their metrics. This is most likely to be a pretty common occurrance. I specifically do not use numbers of clicks or conversions because these can be skewed by the percentage at which your ad was served. The values included in each equation should be independent of the percentage served and give you a more accurate picture of their performance. To decide between the two of these, I take a look at my hard data. Ad variation 1 has a better Success Rate, but a poorer Positional Performance Rate. Ad Variation 2 has a better Positional Performance Rate, but a poorer Success Rate. This particular client is an e-Commerce store, and since the amount of traffic that would be brought in (based on PPR) is minimally different between the two, I would use my SR metrics to determine that Ad Variation 1 is my winning ad.
Using these algorithms to clean house for ad groups with 3+ ads is especially useful. It is easier to find the weakest ad in groups of 3 or more than 2. In some instances, you will find that one ad is surprisingly outpacing another. Great! It’s easy to be biased in what you assume will be a better performing ad. I do it in my bigger campaigns all the time when I have really pushed to change wording in a certain way. This helps take the bias out of determining ad winners, can be plugged into a spreadsheet easily, and looks pretty damn impressive when reported visually to a client.

